The Query builder is the heart of GraphPolaris. It lets you explore your graph data by making questionns visually, manually using cypher, or via natural language. The visual mode is especially intuitive: simply drag, connect, and analyze the results through interactive visualizations.
Within this panel, you can write queries in different modes, add multiple queries, and fine-tune query parameters.
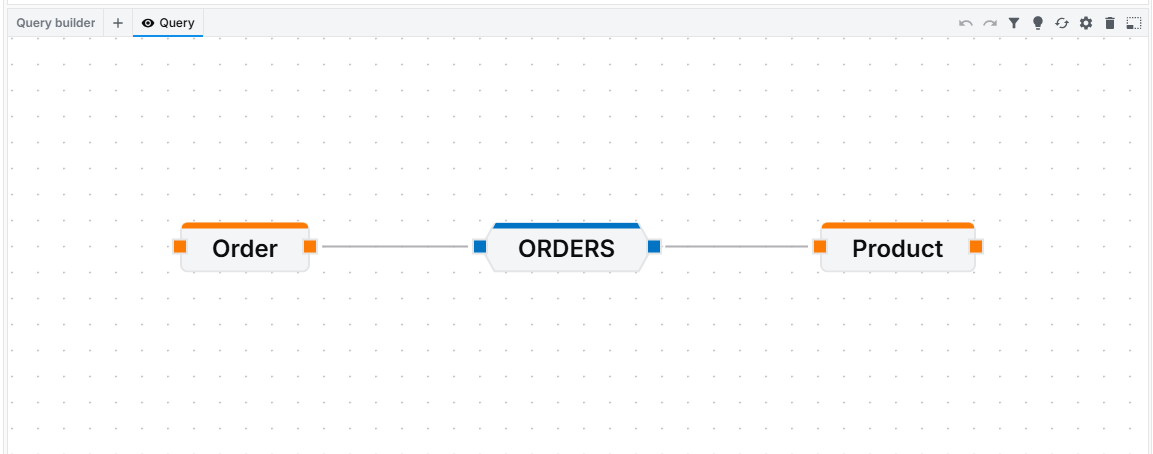
The diagram below shows a schematic overview of the Query Builder panel:
Query tab
Each tab represents an independent query. Tabs allow you to build, rename, duplicate, and compare multiple queries within the same workspace.
Query settings
Provides access to additional Query Builder controls, such as limits, execution options, visualization settings, and advanced features.
Query panel
The main workspace where queries are built visually, edited, and executed. Pills are placed and connected here to define query structure and logic.
Query Tabs
By clicking the plus (+) icon, you can add new query tabs to the Query Builder panel.
Each query tab contains an independent query, which can be any of the query types described earlier.
This is useful when you want to build queries incrementally or compare different approaches.
You can also rename and duplicate existing query tabs.
Query Buttons
At the top-right of the Query Builder panel, you’ll find buttons that control additional Query Builder settings:
Limit
Limits the number of elements returned by the query.
Machine Learning
Runs machine learning algorithms on the query, such as Link Prediction, Centrality, Community Detection, and Shortest Path.
Rerun Query
Executes the current query again.
Query Builder Settings
Configures options for the visual Query Builder.
Clear Query Builder
Clears the current visual query.
Fit to Screen
Adjusts the view so the entire visual query fits on the screen.
Structure of this section:
- Writing queries — Learn how to query your data
- Visual Drag & Drop — Learn how to use the drag-and-drop mechanism
- Manual cypher — Learn how to use the manual cypher mode
- Natural language using AI — Learn how to query using AI-powered natural language
- Other Query builder functionality — Explore additional Query builder features