We've had graph visualization for 20 years. Why are you still exporting CSVs into Cytoscape?
You already know you need a graph. That is not the argument. You have been drawing node-link diagrams since grad school, and you do not need a vendor to explain that relationships matter. So here is the question nobody answers honestly: why, in 2026, does looking at your own connected data still involve an export button, a CSV, and a tool that has never once seen your database?
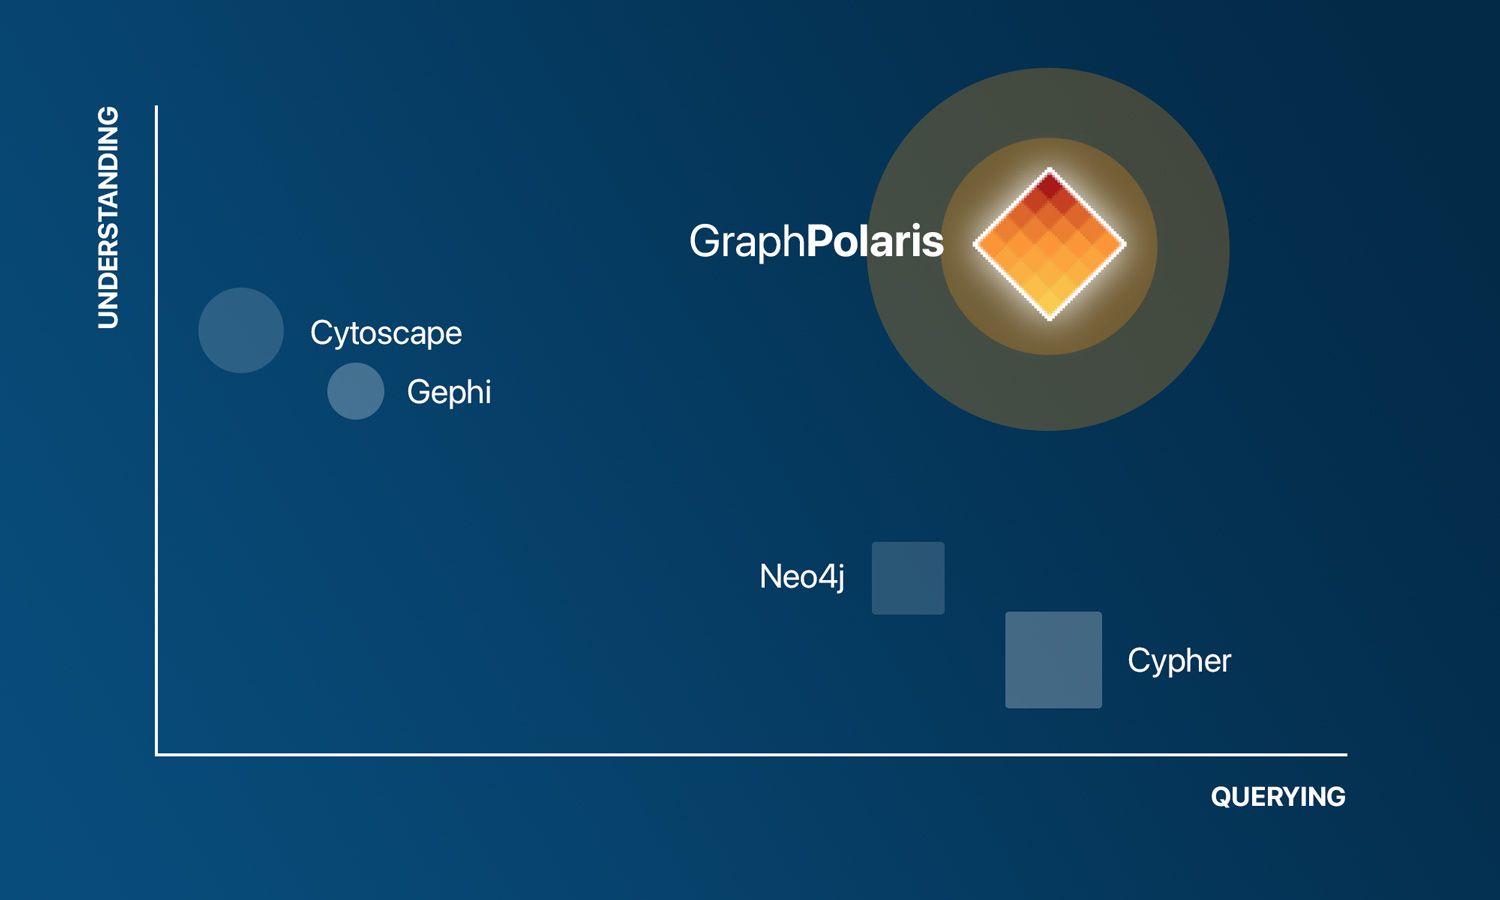
The tools are not new
Graph visualization is not emerging technology. It is old. Cytoscape was rendering protein-interaction networks for biologists two decades ago, back when "big data" was still a conference buzzword. Gephi became the academic's default soon after. Graphviz and Pajek reach back further still. Graph databases have been in general hands for the better part of twenty years. This is mature, well-trodden ground.
So why does the work still feel like assembly by hand?
Every tool picks a side
Because each one solved half the problem. They either store the graph or they draw it. Never both, and never in a loop.
Graph databases store. Neo4j and the ones after it hold your relationships beautifully, then hand you a query language. You write Cypher, you get a result set, and if you want to see it as a structure you ship it somewhere else.
Visualization tools draw. Cytoscape, Gephi, Tulip were born on the lab bench, built to render a network that someone had already assembled. They have never been wired to your live data source. So your real workflow looks like this: query the database, export, import into the viz tool, spot a modeling mistake, go back, rewrite the query, export again, import again.
The disconnect is not a missing feature. It is the entire shape of the category. You are the integration layer. Your afternoon is the API between two tools that were never designed to talk to each other.
The vendors who noticed mostly solved a slice
A few saw the gap. They each took a corner of it.
The lightweight layers, Neo4j Bloom and Explore among them, give you a cleaner view sitting on top of a single database. That is a viewer, not an exploration platform; the loop still terminates at one store you already had to build. The others went vertical. Linkurious, Hume, and the investigation-focused tools are genuinely sharp inside fraud or intelligence work and stop at the edge of that domain. Useful, but narrow.
Nobody built the general-purpose platform where connecting, querying, shaping the schema, and visualizing all happen in one continuous loop. That is the category that was missing, and it is the one worth leading.
What end-to-end actually means
End-to-end is not "we also ship a graph view." It is this: point at your data, including the relational data you already have, build and rip up a schema as fast as you can think, ask the question, see the structure, change the question, and watch the picture move with you. No export, no second tool, no afternoon spent being the glue. It is the hypothesis-and-experiment loop the field described more than 25 years ago, finally living in one place instead of being stitched together by the analyst.
The graph was never the hard part; the missing piece was the platform to actually use it.
It exists now. See it working on real connected data. Watch the demo →