Your BI Gives Business Information, Not Intelligence
Business Intelligence is a misnomer. The industry has been shipping Business Information for twenty-five years and calling it Intelligence. The difference is structural, and your analysts are paying the price for it.
The original promise was Intelligence
In the year 2000, two Stanford researchers, Chris Stolte and Pat Hanrahan, published a paper called Polaris. The claim at its heart:
Because of the size of the data sets, dense graphical representations are more effective for exploration than spreadsheets and charts. Furthermore, because of the exploratory nature of the analysis, it must be possible for the analysts to change visualizations rapidly as they pursue a cycle involving first hypothesis and then experimentation.
Three years later, Stolte and Hanrahan co-founded Tableau with Christian Chabot, who drove its commercialization. The mission the company still publishes today is "help people see and understand data." Chabot, its first CEO, put it bluntly in a 2012 InfoWorld interview: the goal was to "wrest business intelligence from the grip of specialists and hand it to a broad swath of business users."
Notice what that promise was about. Not reporting. Not dashboards. An exploratory loop: hypothesis, experiment, refinement, at the speed of human thought. That is what Intelligence was supposed to mean. Our platform is named after that paper. Michael Behrisch (Utrecht University) and Remco Chang (Tufts University) have spent more than a decade in visual analytics research for exactly this reason. The original specification was never finished.
What the industry actually shipped
Look at the BI industry in 2026; Power BI, Tableau, Qlik, Looker. Every product page leads with dashboards, reports, and KPIs. Further down: "governed self-service," which means IT decides what the business is allowed to explore. That is Information, prepared and served. Competent for flat data and shallow joins. Also a ceiling. Actual adoption of BI tools sits at 25% of employees and has been stuck around 20% for years. The problem is not that dashboards need to be prettier. The problem is that the exploratory cycle never reached the depth most business questions require.
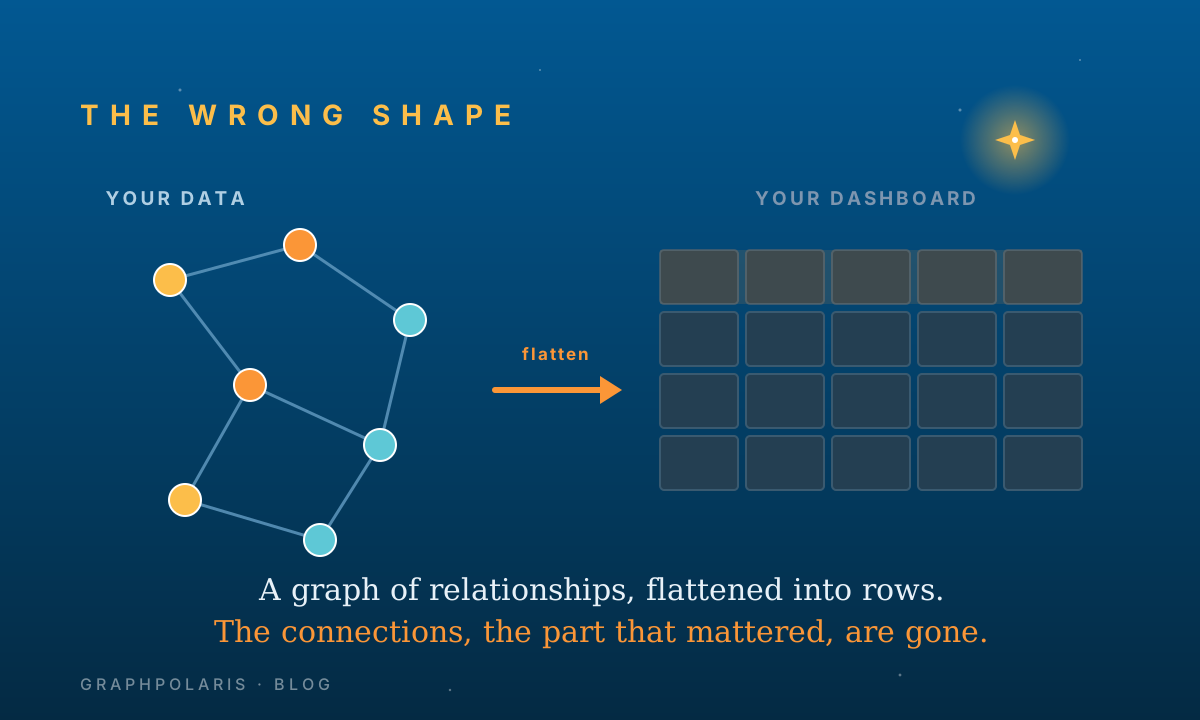
SQL handles tables. It does not handle relationships at depth. Relational, key-value, and document models all treat relationships as second-class citizens. They are an afterthought expressed in foreign keys. This is not a feature that the next release fixes. It is a floor written into the query language.
Every decision your organization makes that requires relationship-depth is currently being made on a flattened picture. Your dashboards are not lying. They are looking at the wrong shape.
Generative AI is not the rescue
In the early 2010's, Hadoop was going to unlock business insight. By 2018, Cloudera and Hortonworks merged in what the trade press called ecosystem contraction. Gartner in the meantime, had already dropped big data from its Hype Cycle three years earlier. The ROI never materialized. Today, the pitch is that a large language model plugged into your data fixes the exploratory gap. It will not.
Many of the new AI wrapper tools are trying to solve the text-to-SQL problems, but are coming now where close to what humans achieve. Tested AI on actual analytical work repeatedly returns "30% nonsense, which I personally believe is too much nonsense." - Benn tancil, Jan 2026
The deeper problem is structural. Language models are generative. Generation is not interrogation. Yann LeCun, Meta's Chief AI Scientist and a Turing Award winner: language models "cannot reason in any reasonable definition of the term." Even at temperature zero, the same question asked twice can return different answers; research shows up to a 70% gap between the best and worst runs on identical inputs. You cannot audit what refuses to be the same thing twice. Retrieval augmentation reduces hallucination. It does not eliminate it. GraphRAG, the latest wrapper, inherits the failure modes of its underlying graph; although GraphRAGs can enlarge the context window, their nature is still generative.
Generation is probabilistic and non-deterministic storytelling and works very well for brainstorming and ideation. True Business Intelligence must return deterministic evidence. These are different categories of software and use-cases.
What Intelligence actually requires
The requirements for exploratory analytics were named twenty-five years ago: dense graphical representations, and a rapid cycle of hypothesis and experiment. Not niceties. The minimum specification.
Two more are structural today. Deterministic: the same question, the same data, the same answer, today and after an audit. Traceable: the analyst points at the evidence chain and sees every step from question to conclusion.
Visual, exploratory, deterministic, traceable, and built for the relationships that make business questions actually interesting. That is what Business Intelligence was always supposed to be. The industry shipped half of it and called it done.
We kept the name of the paper on purpose.
See it working on real connected data. Watch the demo →
Announcing GraphPolaris Explorer 1.0: A New Era in Data Exploration
We are excited to announce a major milestone in the GraphPolaris journey!
We've had graph visualization for 20 years. Why are you still exporting CSVs into Cytoscape?
Graph tooling is two decades old. The reason looking at your own connected data still feels like manual labor is that every tool picked a side: store the graph, or draw it. Never both, never in a loop.