FaBrick

Integration of your data to our product. We currently support Neo4j and opencypher-powered graph databases.
ModelBuilder
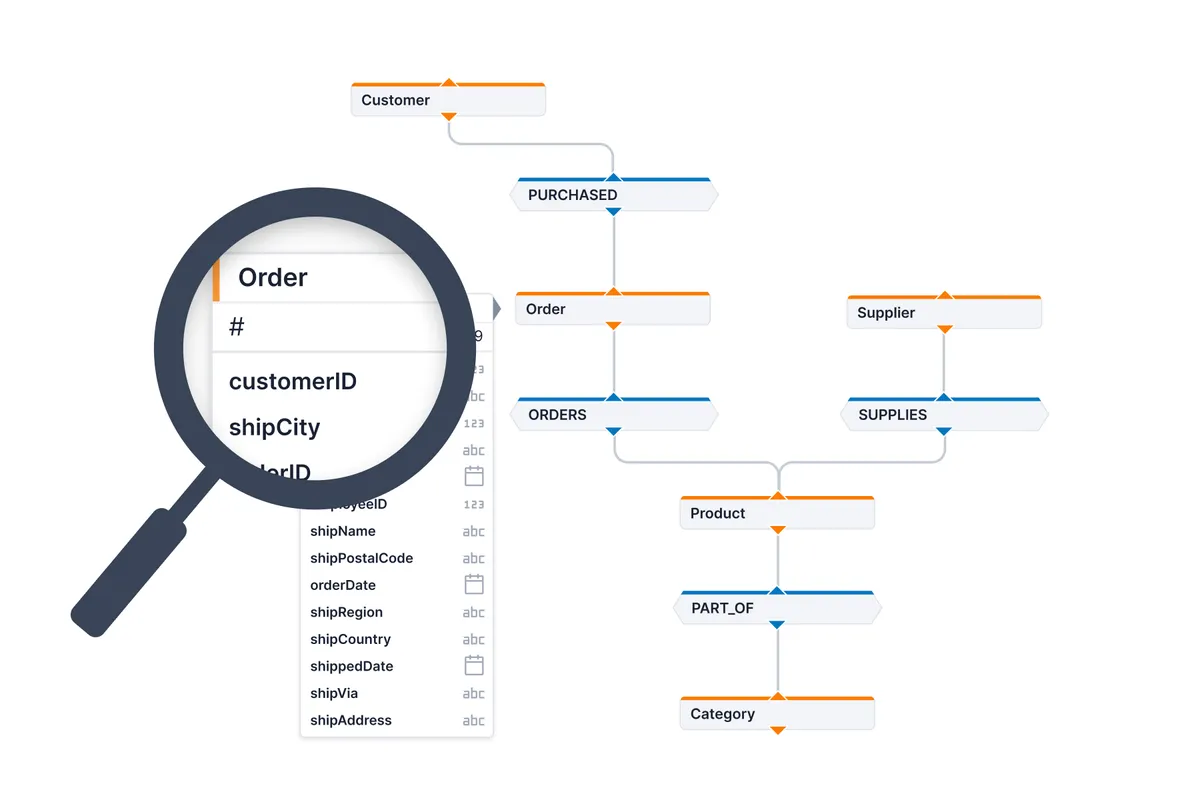
GraphPolaris models your data for you to inspect it further.
QueryCoach

Get a first simple glance at your data and its relationships. Visually inspect its components and how they are connected to each other. Build your first hypotheses on your questions.
Augmentor

Inspect your connections further by augmenting the data with our machine learning options.
InSight

Set on the final output of your case study. Share your insights with our high-quality and impactful visualizations!