GraphPolaris is a no-code visual analytics platform that makes graph database analysis accessible to everyone - whether you're a data analyst or a domain expert. You can explore complex relationships in your data without writing queries.
Quick Start
1. Sign Up
Create an account to have access to the interface.
2. Start Exploration
Click Add your first Database and either:
- Connect to your graph database Add credentials to your database
- Load a demo database to explore sample data immediately.
After this you can start the exploration of that database. See more about adding data.
3. The Interface
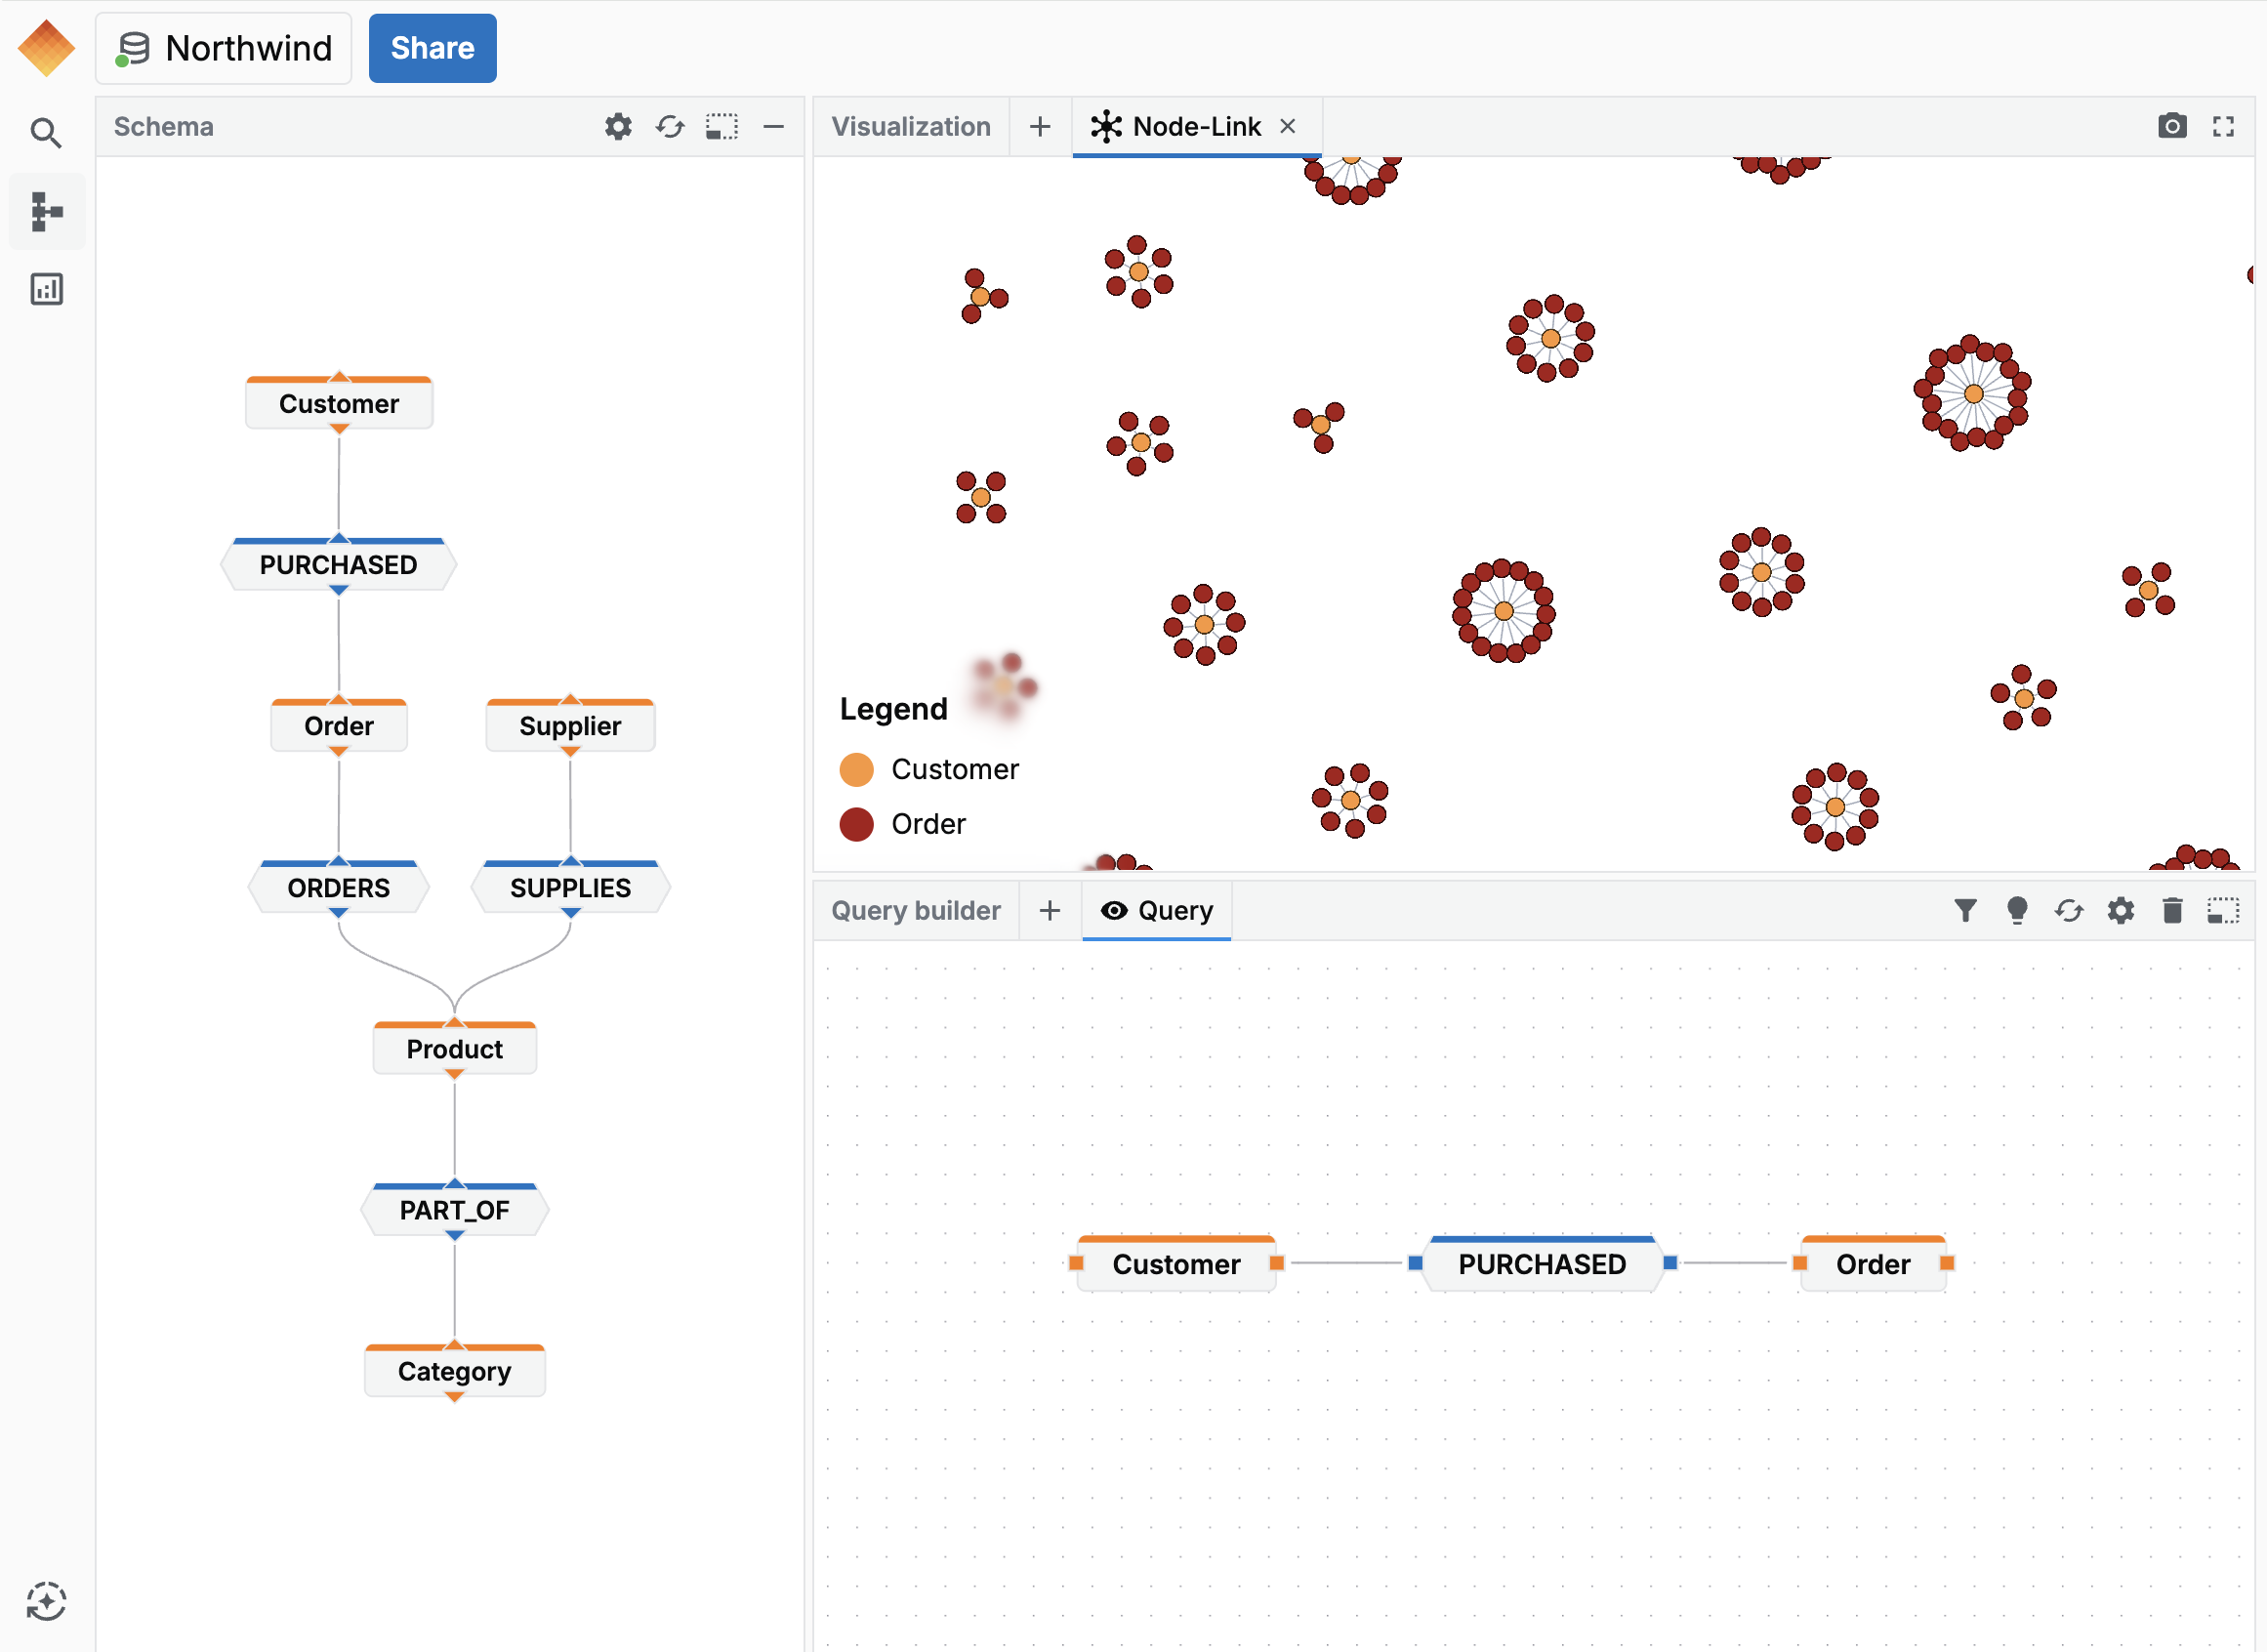
Once your project loads, you'll see three main areas:
Schema panel
(left)Your database structure: which nodes exist (Person, Product, Company) and which relationships connect them (KNOWS, PURCHASED, WORKS_AT).
Visualization panel
(top)Where answers appear. Multiple visualization options available - the recommended one for your query is highlighted.
Query builder
(bottom)Formulate questions three ways: visually drag-and-drop nodes, write Cypher directly, or describe in natural language.
4. Start Exploring
Here the basic Explorer workflow is explained:
Drag nodes from the schema
Pick what you're looking for (e.g., Customers, Products, Transactions) and drag them into the query builder. This defines the entities in your question.

Connect with other nodes
Link node pills to specify how they relate (e.g., Customer PURCHASED Product). This builds the pattern you want to find.
Run and visualize
GraphPolaris will auto-execute your query while you build your query. Results appear in the visualization panel - switch between views (node-link, matrix, Sankey, map) to reveal different patterns.
Then keep exploring - each answer leads to new questions:
Adjust settings
(colors, sizes)Customize visualization appearance to highlight the patterns that matter most.
Add filters
(narrow down)Filter by date, value, or category to focus on specific subsets of your data.
Ask AI
(plain English)Describe what you want to find and let the assistant build the query for you.
Next Steps
Ready to dive deeper?
- Adding Your Data - Learn how to connect databases and import files
- Analysing Your Data - Master the query builder and visualizations
- Deployment - Set up GraphPolaris for your organization
Getting Help
- In-app chat: Click the assistant icon in Explorer for AI-powered help
- Documentation: You're here! Browse the sidebar for detailed guides
- Support: Contact us at [email protected]